
19 November 2025 | Wednesday | News
Picture Courtesy | Public Domain
Investing.com, one of the world's largest financial platforms used by more than 60 million investors each month, announced a major upgrade to its AI-powered investing tools that delivers complete trading plans in under 60 seconds.
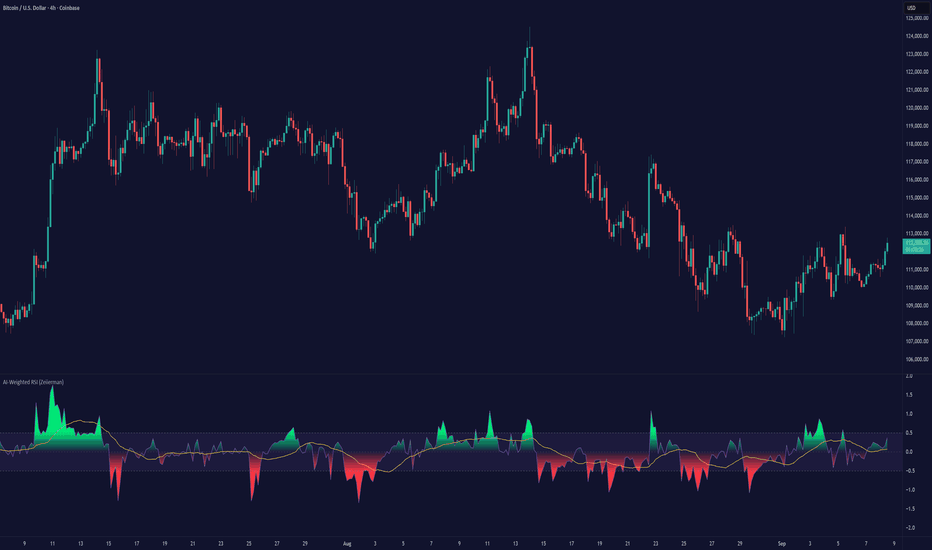
The new AI chart analysis feature leverages Investing.com's Vision AI engine to interpret charts like a market expert — spotting candlestick formations, support and resistance levels, breakouts, and trend shifts that can make or break trades.
Built specifically for day traders and active market participants, the feature transforms hours of manual analysis into concise, actionable trading plans — giving users the clarity and speed they need to seize opportunities in real time.
Unlike traditional charting tools that simply calculate indicator values, AI chart analysis cuts hours of manual analysis down to less than one minute and provides:
"Regular chatbots can't see charts, ours can," said Yonatan Adest, CTO of Investing.com. "We've given AI the eyes and reasoning of a seasoned trader, so it can recognize setups like breakouts or head-and-shoulders patterns, analyze multiple indicators across timeframes, and explain its reasoning in plain language. It's like having a Wall Street analyst sitting beside you, only faster and always available."
The new feature will be available across all 30 of Investing.com's language editions, giving traders and investors worldwide access to professional-grade analysis in their native languages. This global rollout reinforces Investing.com's commitment to making advanced financial intelligence accessible to users around the world — from New York and London to São Paulo and Seoul, and everywhere in between.


Fintech Business Asia, a business of FinTech Business Review
© 2026 FinTech Business Review. All Rights Reserved.